All Images
Introduction to R and RStudio
Figure 1
Image 1 of 1: ‘Screenshot of RStudio showing the 4 "panes".’

Figure 2
Image 1 of 1: ‘Screenshot of the RStudio Global Options, with "Restore .RData into workspace at startup" unchecked, and "Save workspace to .RData on exit" set to "Never".’

Figure 3
Image 1 of 1: ‘RStudio Files pane with current directory path highlighted.’

Data visualization with ggplot2
Figure 1
Image 1 of 1: ‘Blank plot area after calling ggplot without specifying variables to plot’

Figure 2
Image 1 of 1: ‘Blank plot area, now variable names in the x and y axes, but not showing a plot as we haven't specified how we want the data to be displayed, what type of plot to do’
Figure 3
Image 1 of 1: ‘Scatter plot of the weight and hindfoot_lenght variables, showing a positive relationship between the two’

Figure 4
Image 1 of 1: ‘Same box plot between weight and hindfoot_lenght variables as the previous one, but now with transparency’

Figure 5
Image 1 of 1: ‘Same box plot between weight and hindfoot_lenght variables as the previous one, but now changing the color of points to blue’
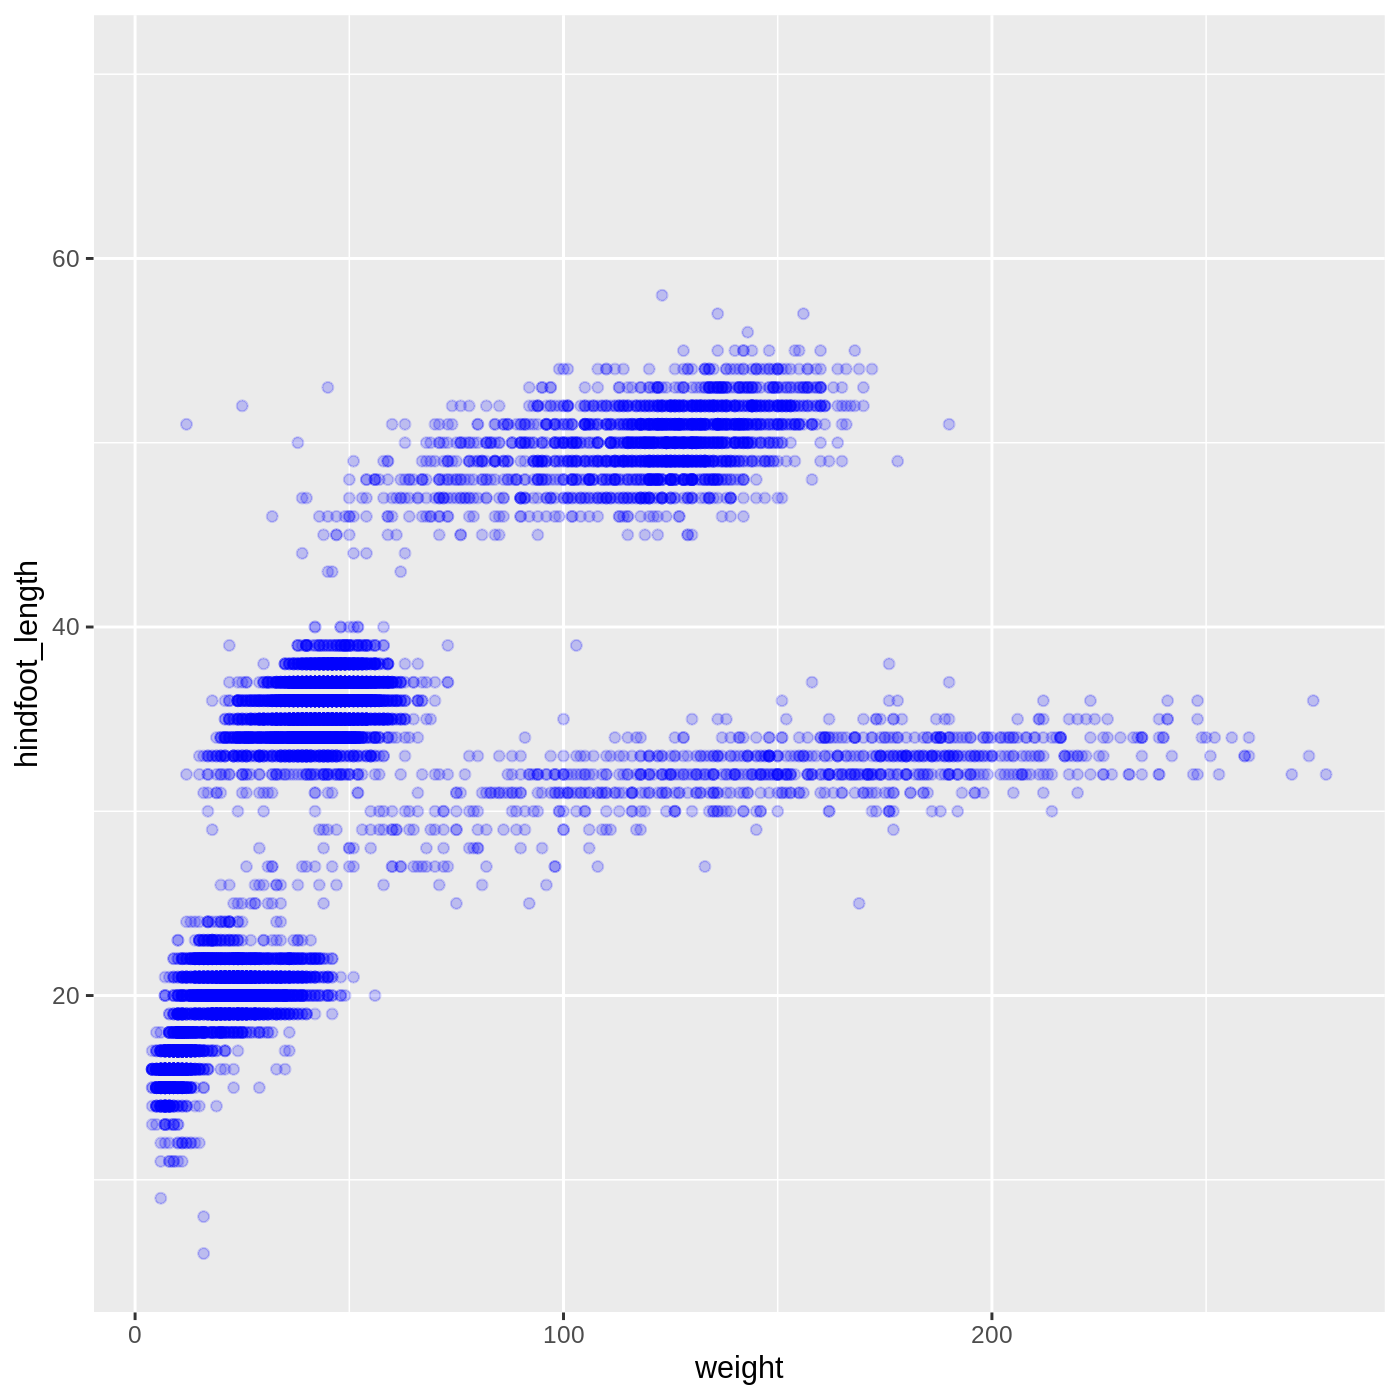
Figure 6
Image 1 of 1: ‘Box plot between weight (in the x-axis) and hindfoot_lenght (in the y-axis) variables as before, but now changing the color of points according to plot_type’

Figure 7
Image 1 of 1: ‘Box plot between weight (in the x-axis) and hindfoot_lenght (in the y-axis) variables as before, but now changing the shape of points according to sex’

Figure 8
Image 1 of 1: ‘Box plot between weight (in the x-axis) and hindfoot_lenght (in the y-axis) variables as before, but now changing the color of points according to year’

Figure 9
Image 1 of 1: ‘Box plot between weight (in the x-axis) and hindfoot_lenght (in the y-axis) with color of points according to plot_type, but now changing the color scale’

Figure 10
Image 1 of 1: ‘Box plot between weight (in the x-axis) and hindfoot_lenght (in the y-axis) with color of points according to plot_type, but now modifying the scale of the x-axis to be in log 10 scale’

Figure 11
Image 1 of 1: ‘Empty plot area, using the plot_type (x-axis) and hindfoot_length (y-axis) variables’

Figure 12
Image 1 of 1: ‘Bar chart using the plot_type (x-axis) and hindfoot_length (y-axis) variables, showing the average hindfoot_length by plot_type’

Figure 13
Image 1 of 1: ‘Same bar chart between plot_type (x-axis) and hindfoot_length (y-axis) variables as before, but now with a colored border line for each plot_type bar’
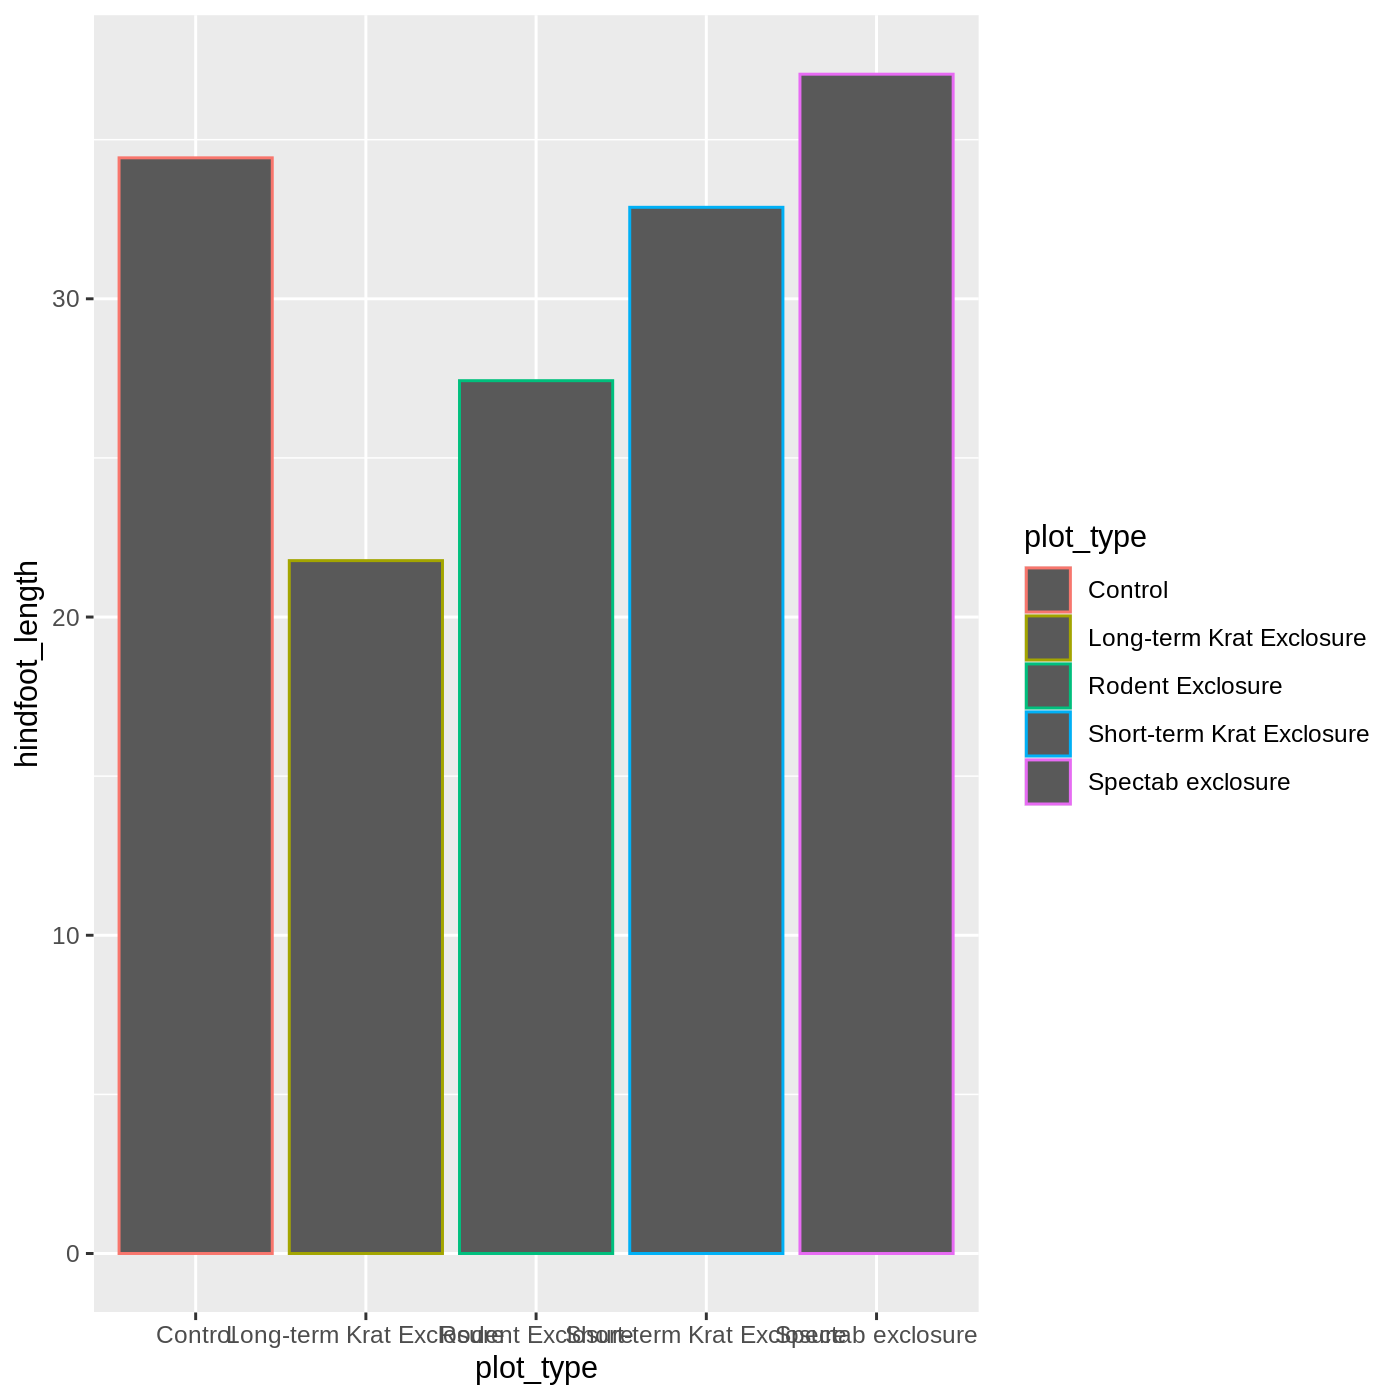
Figure 14
Image 1 of 1: ‘Same bar chart between plot_type (x-axis) and hindfoot_length (y-axis) variables as before, but now with each plot_type bar in a different color’
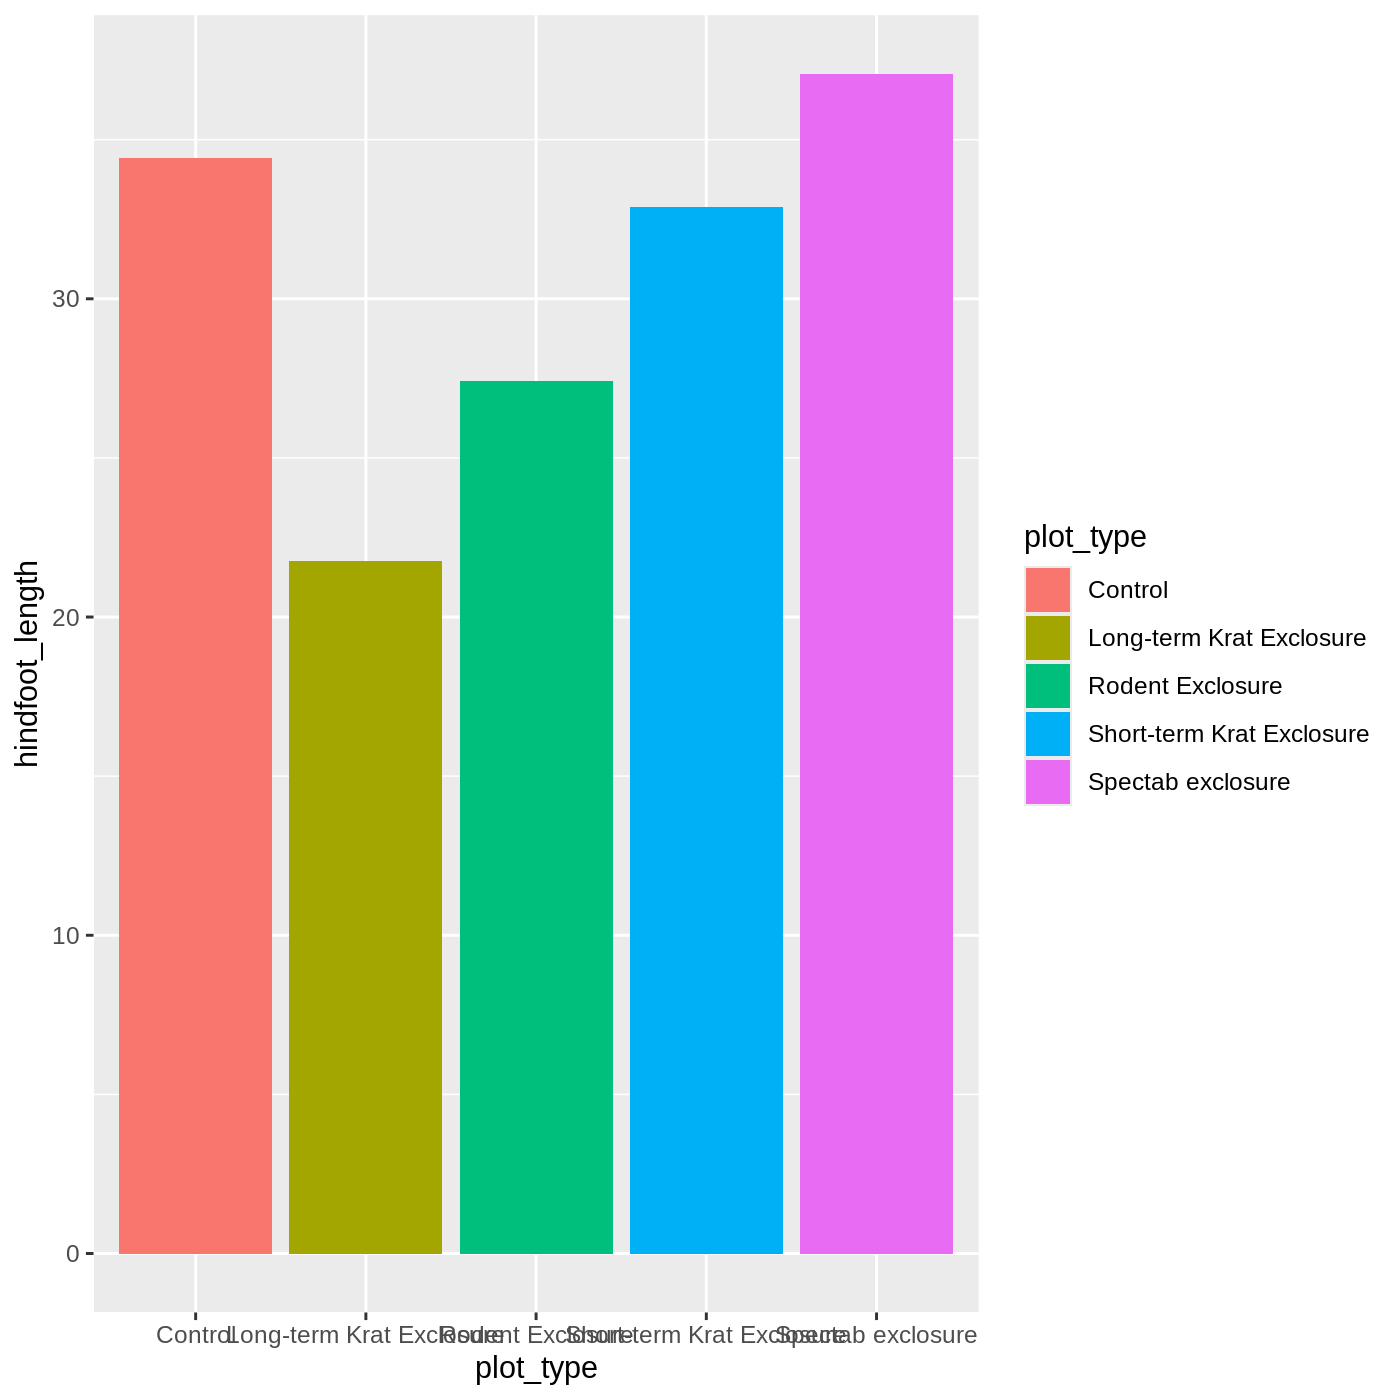
Figure 15
Image 1 of 1: ‘Same bar chart between plot_type (x-axis) and hindfoot_length (y-axis) variables as before, but with wrapped labels for the x-axis, improving readability’

Figure 16
Image 1 of 1: ‘Same bar chart between plot_type (x-axis) and hindfoot_length (y-axis) variables as before, but adding a scatter plot layer on top. However, it is not as useful as all points are cluttered for each plot_type in the x-axis.’
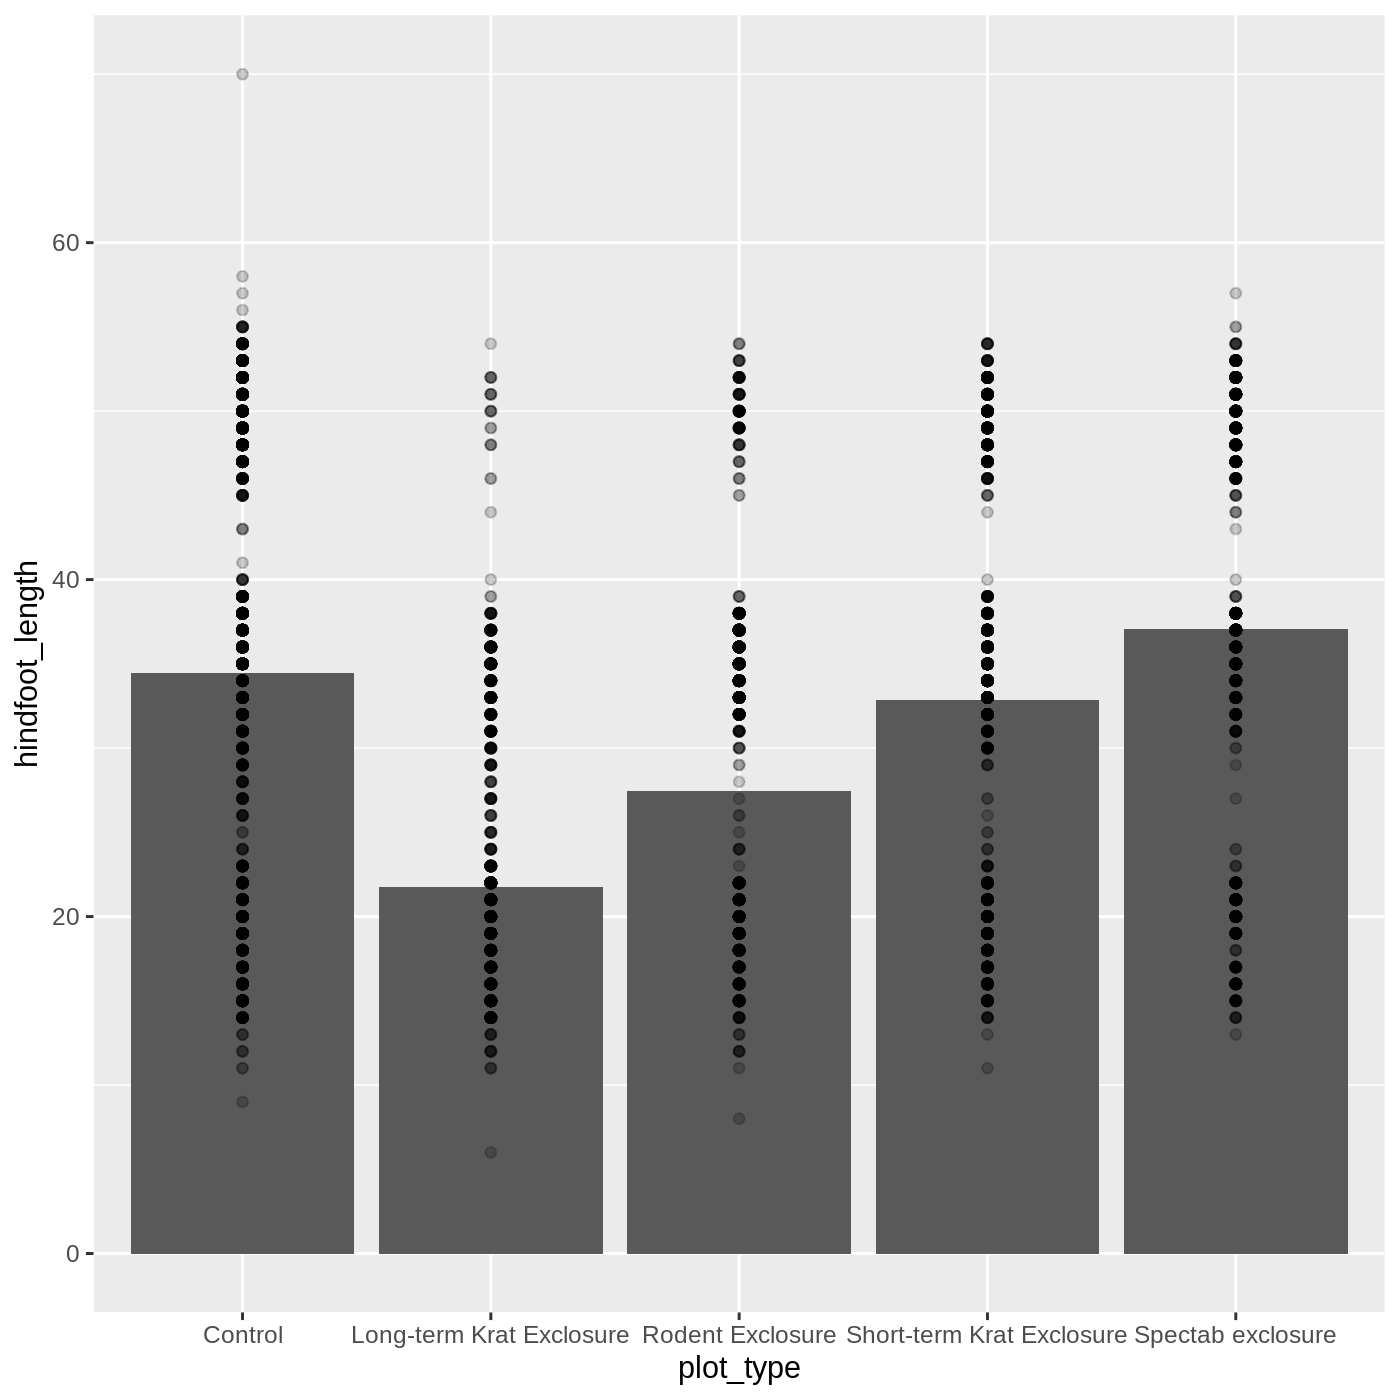
Figure 17
Image 1 of 1: ‘Same bar chart between plot_type (x-axis) and hindfoot_length (y-axis) variables as before, with a scatter plot layer on top for the same variables. Now adding random noise in the x-axis so points don't clutter in the same place.’

Figure 18
Image 1 of 1: ‘Same bar chart between plot_type (x-axis) and hindfoot_length (y-axis) variables as before, with a scatter plot layer on top, but now each bar has a different color while points have all the same color.’
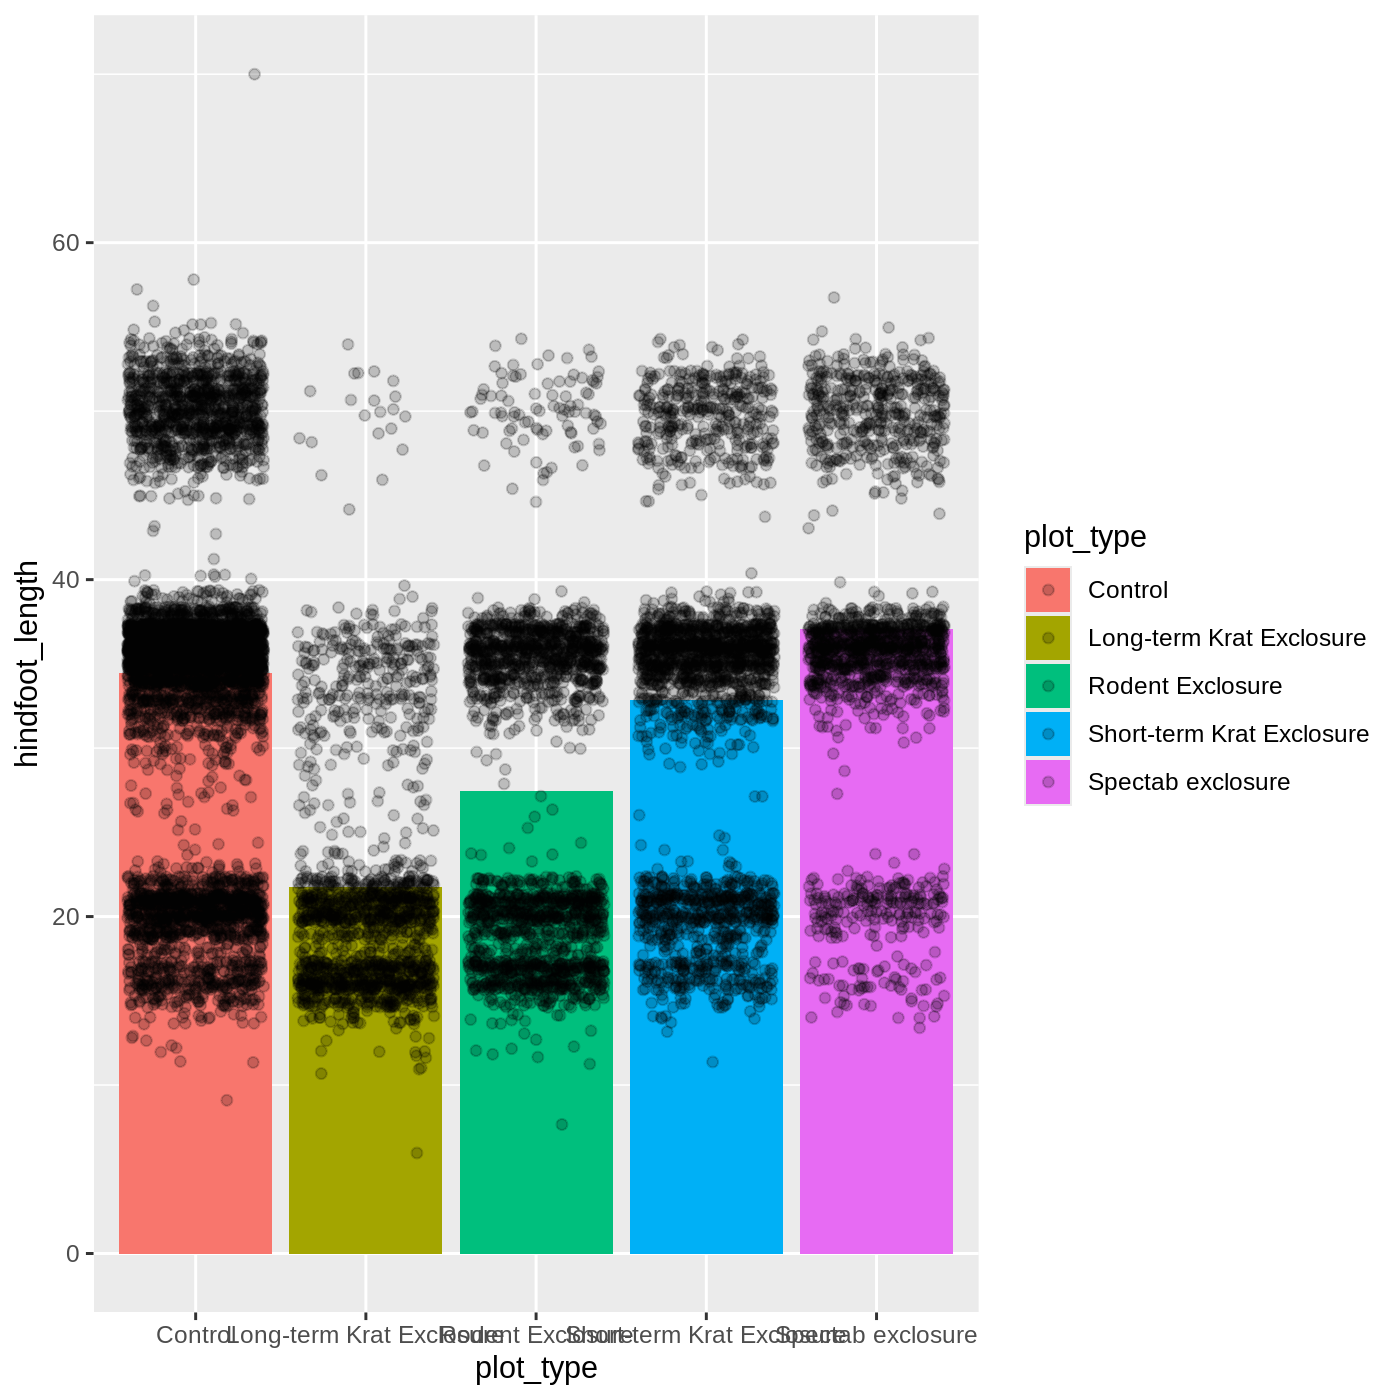
Figure 19
Image 1 of 1: ‘Same bar chart between plot_type (x-axis) and hindfoot_length (y-axis) variables as before, with a scatter plot layer on top, but now each bar has the same color while points have different colors for each plot_type.’
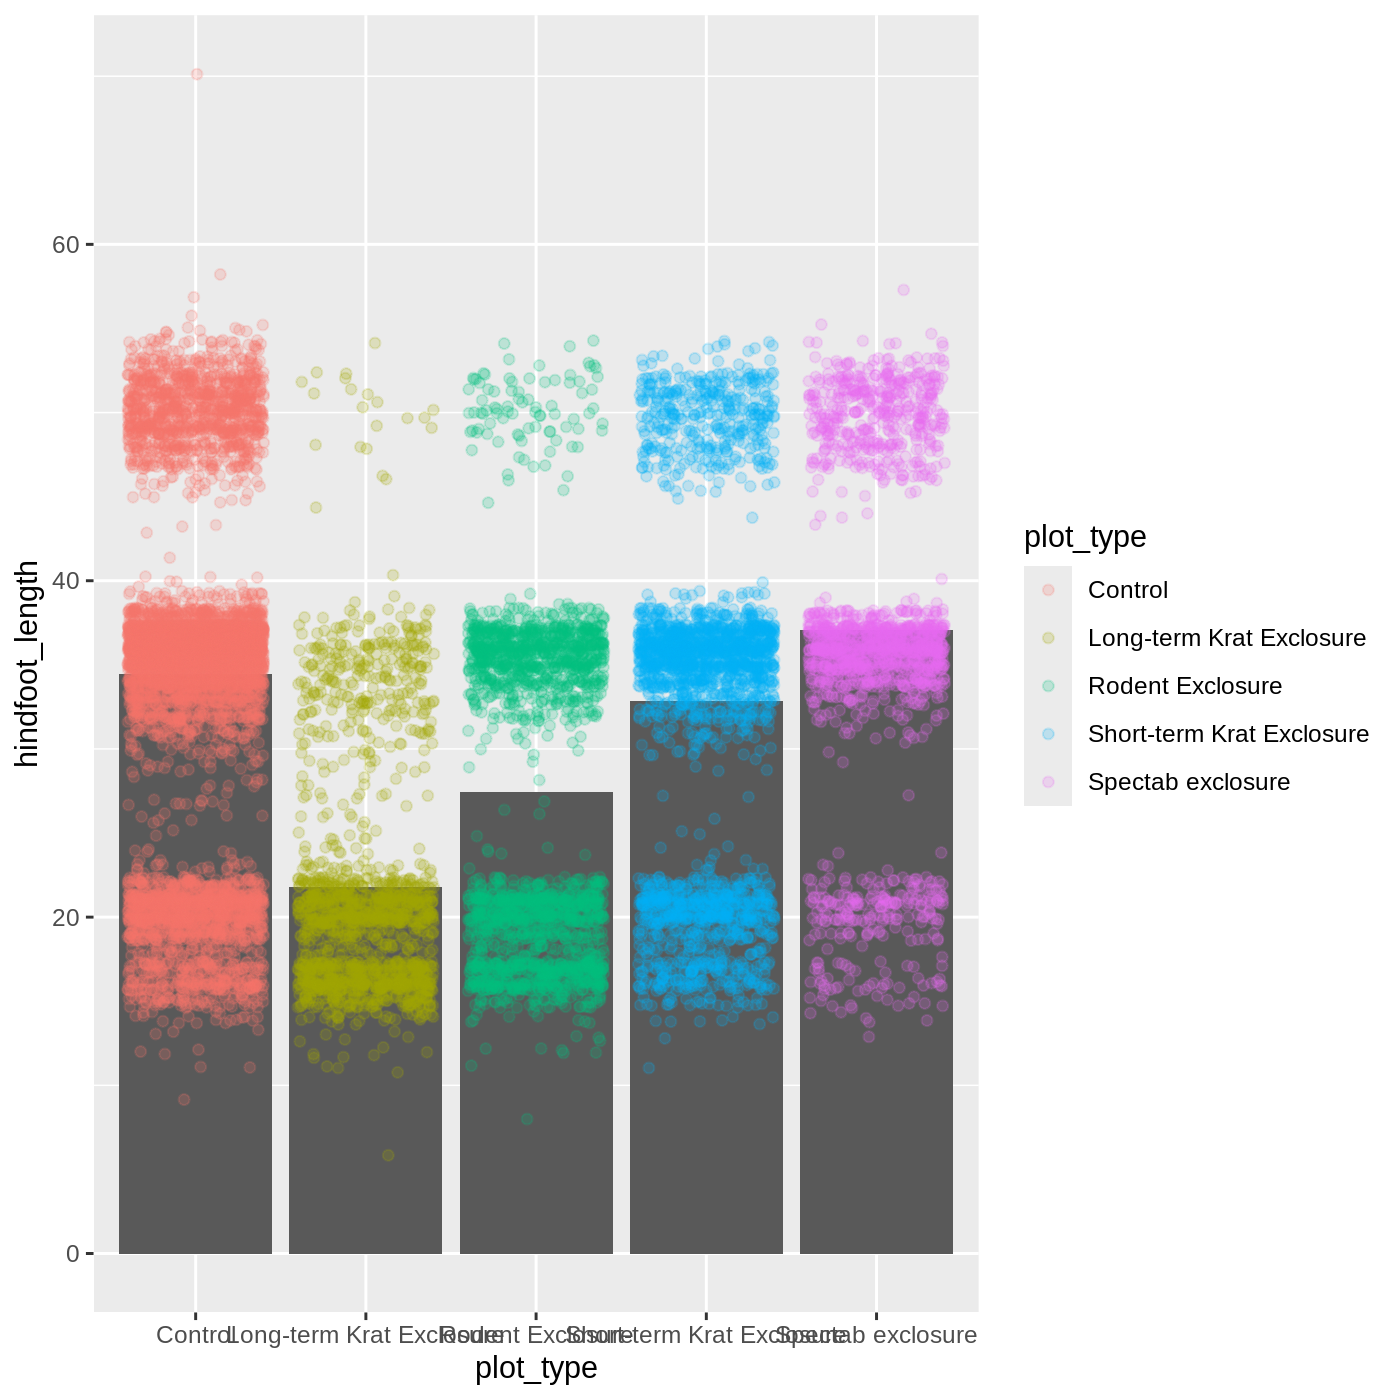
Figure 20
Image 1 of 1: ‘Same bar chart as before, but now the bars are on top of the points of the scatter plot’

Figure 21
Image 1 of 1: ‘Same bar chart as before, but now boxes are transparent and only have black line as a border.’

Figure 22
Image 1 of 1: ‘Bar chart using the plot_type (x-axis) and hindfoot_length (y-axis) variables, showing the average hindfoot_length by plot_type. Now adding error bars for each plot_type.’
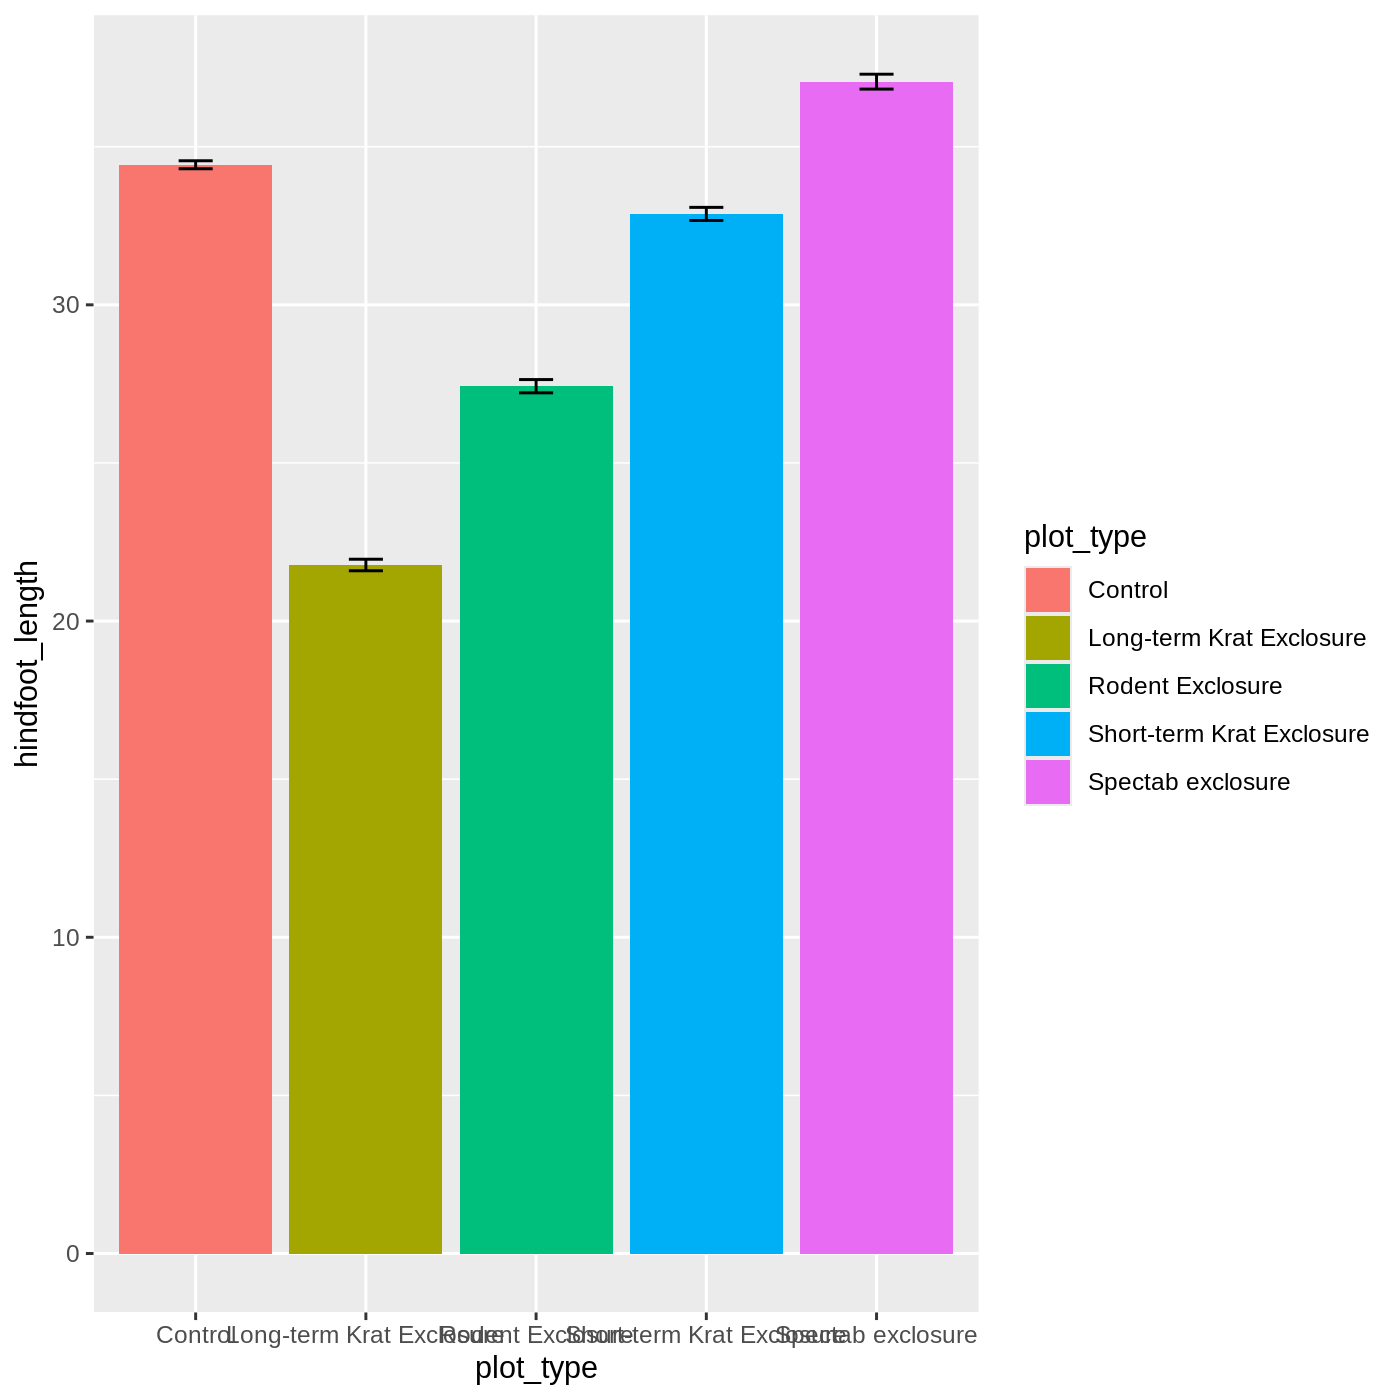
Figure 23
Image 1 of 1: ‘Violin plot on top of a jittered scatter plot showing the distribution of data between the plot_type (x-axis) and hindfoot_length (y-axis) variables.’

Figure 24
Image 1 of 1: ‘Violin plot on top of a jittered scatter plot showing the distribution of data between the plot_type (x-axis) and hindfoot_length (y-axis) variables. Data has different colors according to plot_type.’

Figure 25
Image 1 of 1: ‘Bar plot with border but with fill transparent on top of a jittered scatter plot between plot_type (x-axis) and hindfoot_length (y-axis), and each point for the scatter plot is color according to plot_type.’
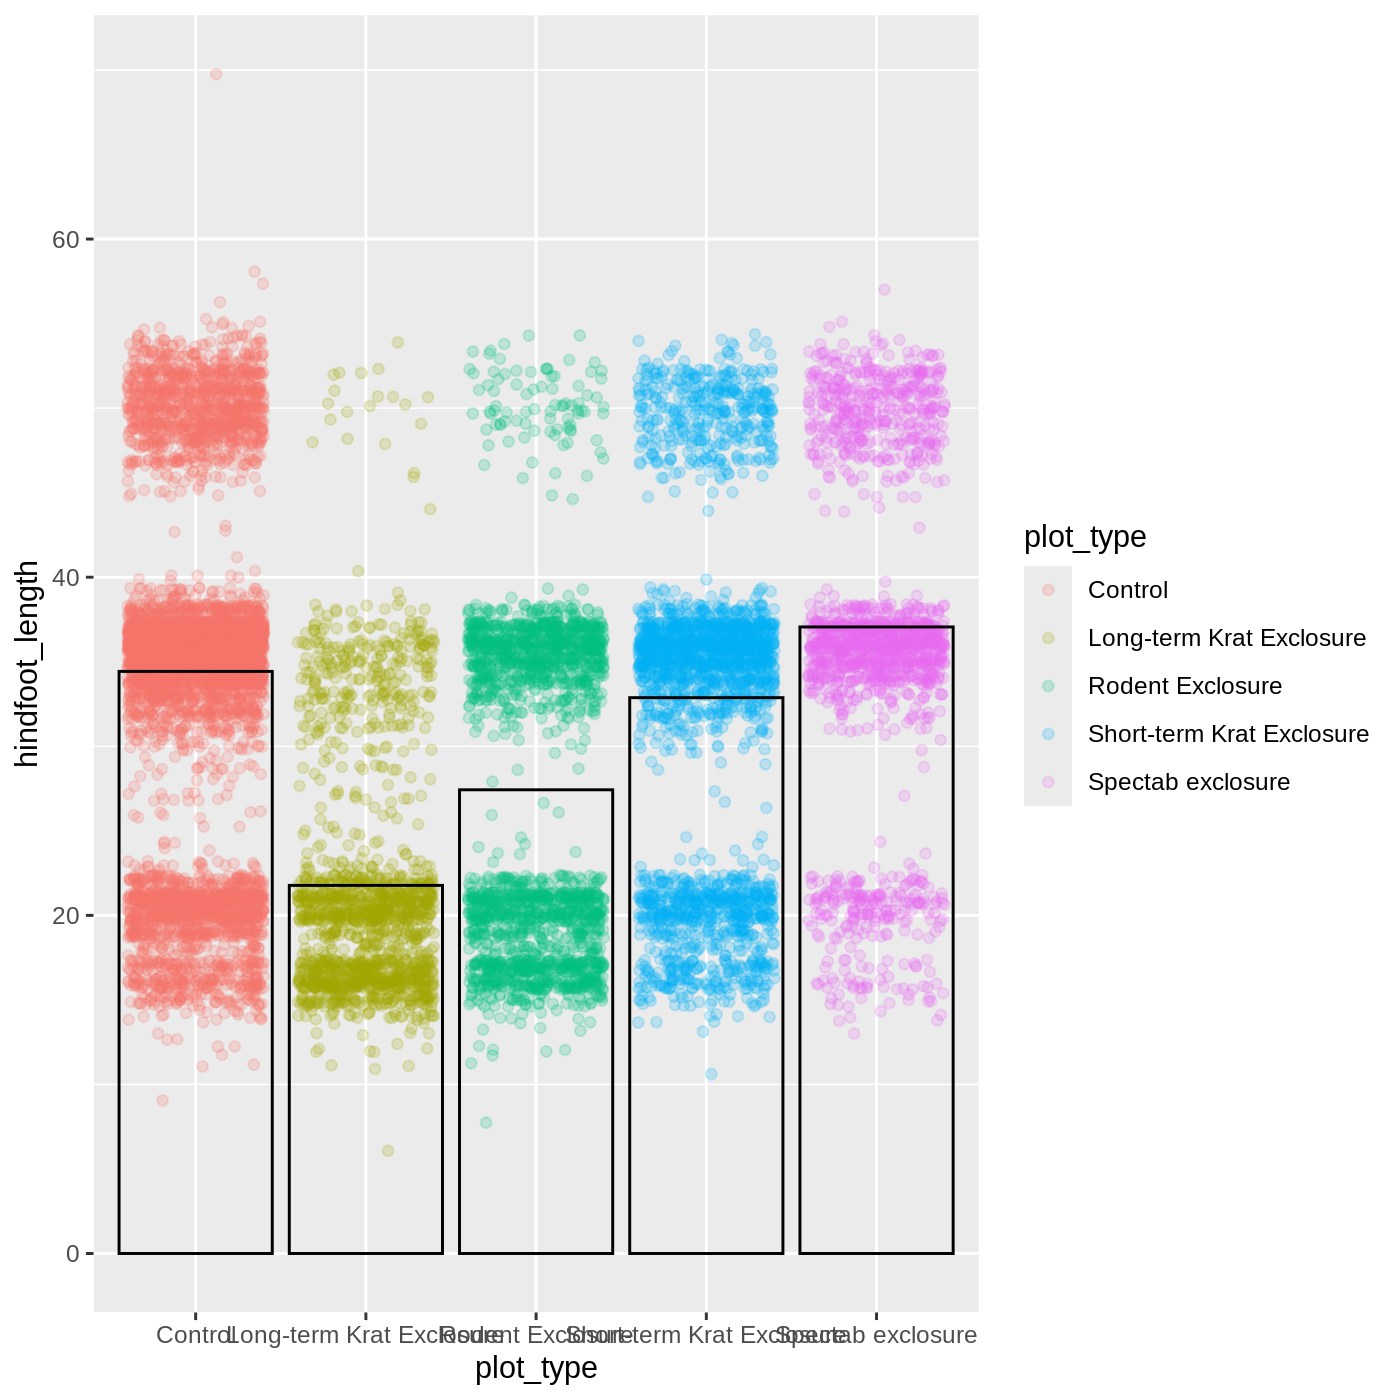
Figure 26
Image 1 of 1: ‘Same plot as before, but now changing the theme to have a white background.’

Figure 27
Image 1 of 1: ‘Same plot as before, but now setting the axes titles size to 14, making them bigger.’
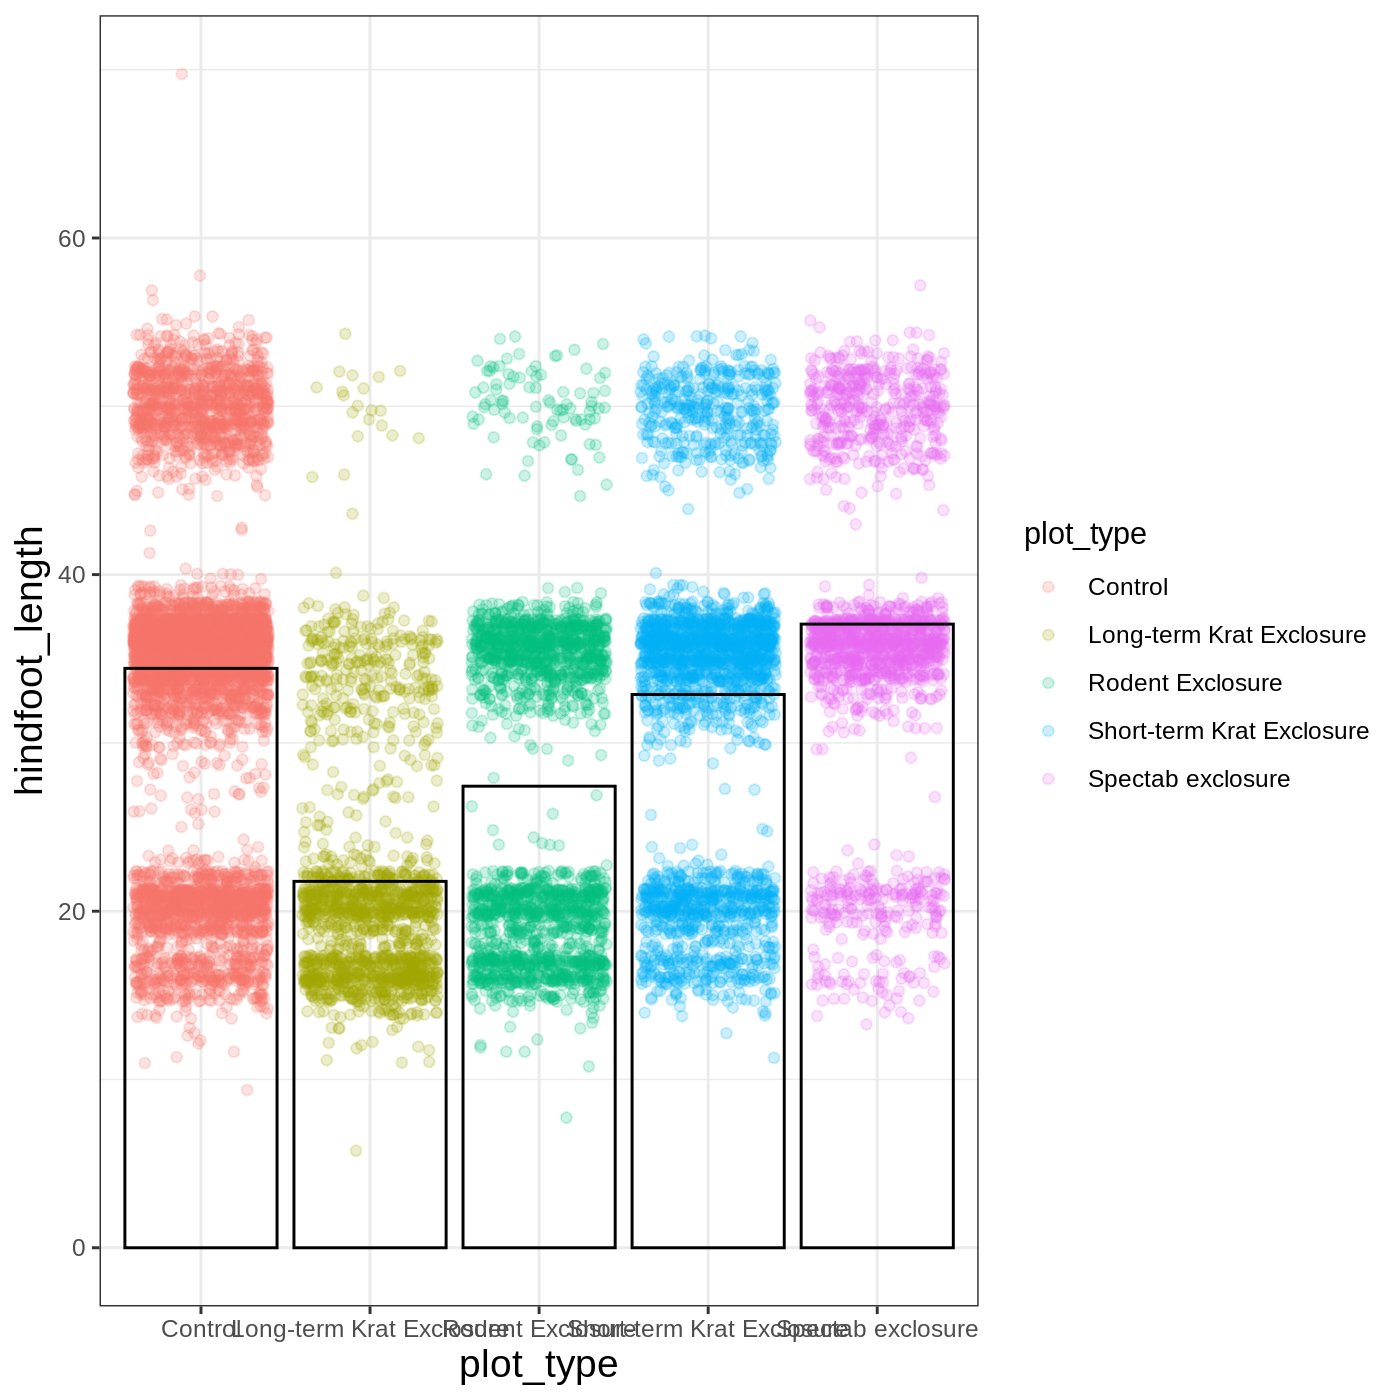
Figure 28
Image 1 of 1: ‘Same plot as before, but now without grid lines for the x axis.’

Figure 29
Image 1 of 1: ‘Same plot as before, but without a legend.’
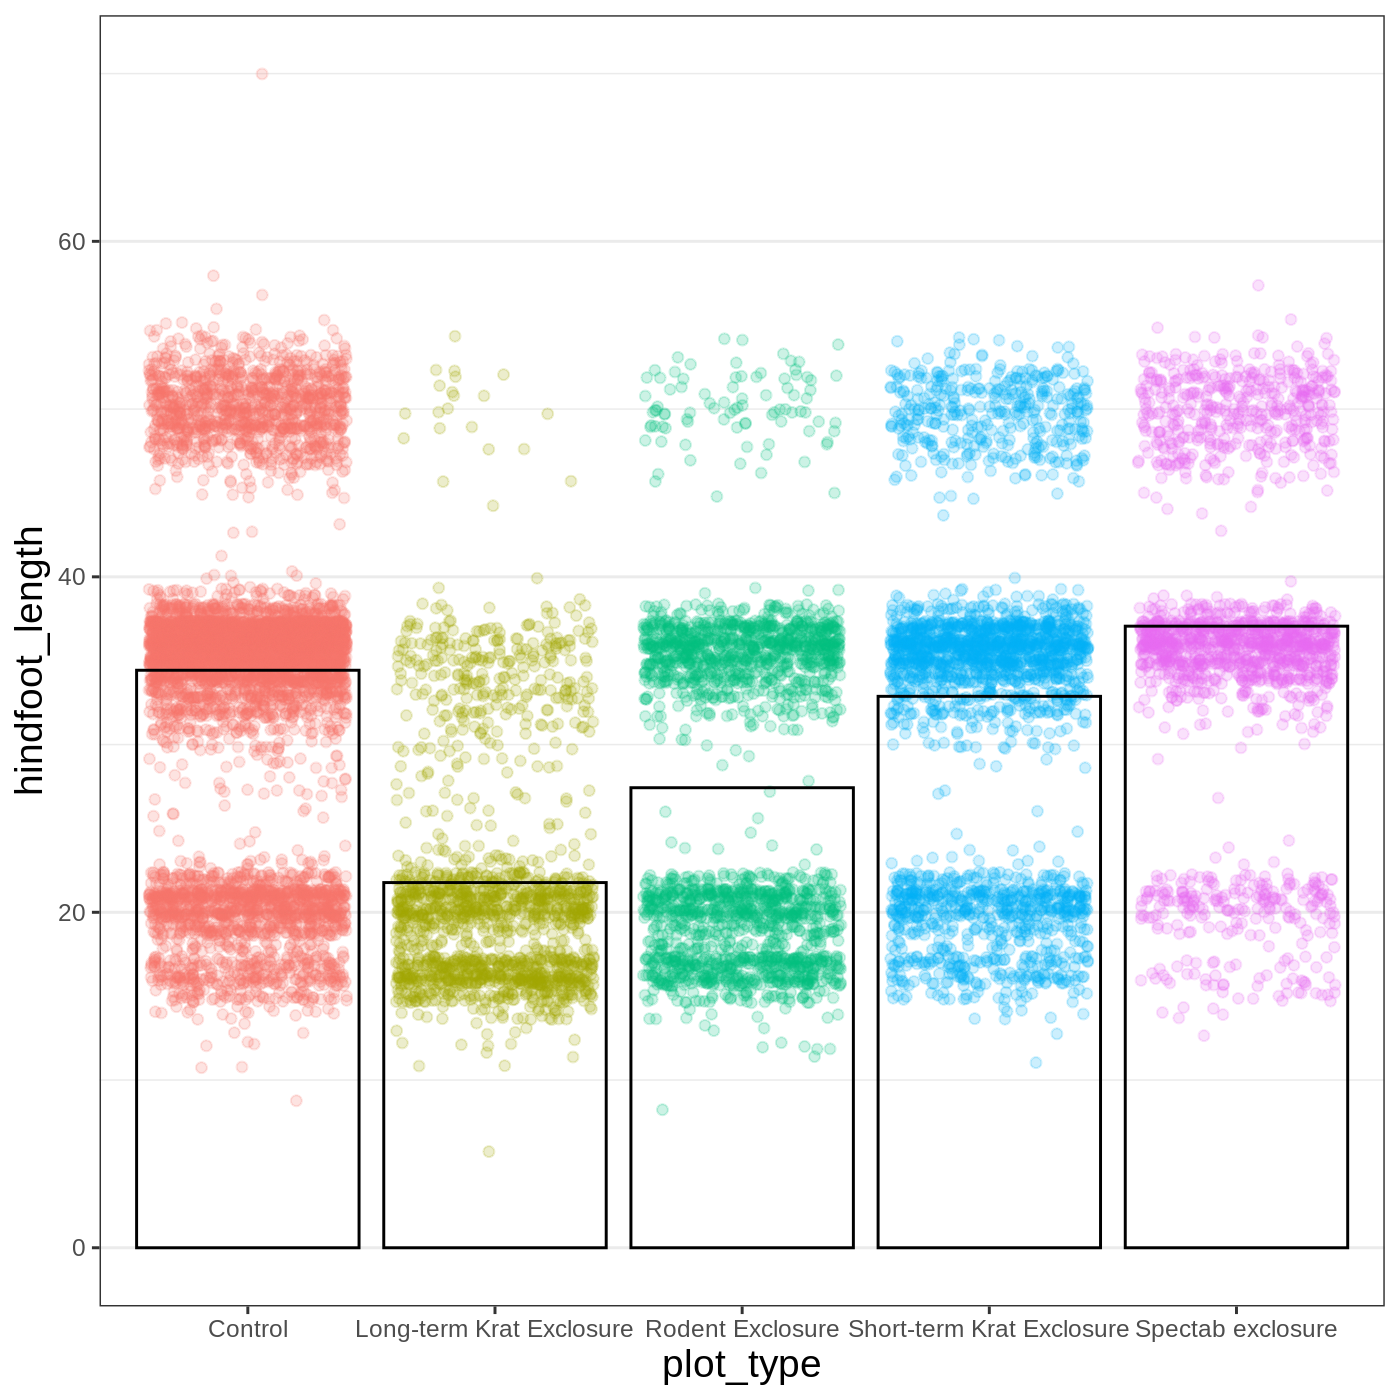
Figure 30
Image 1 of 1: ‘Same plot as before, but now adding a title and more descriptive labels for the axes.’
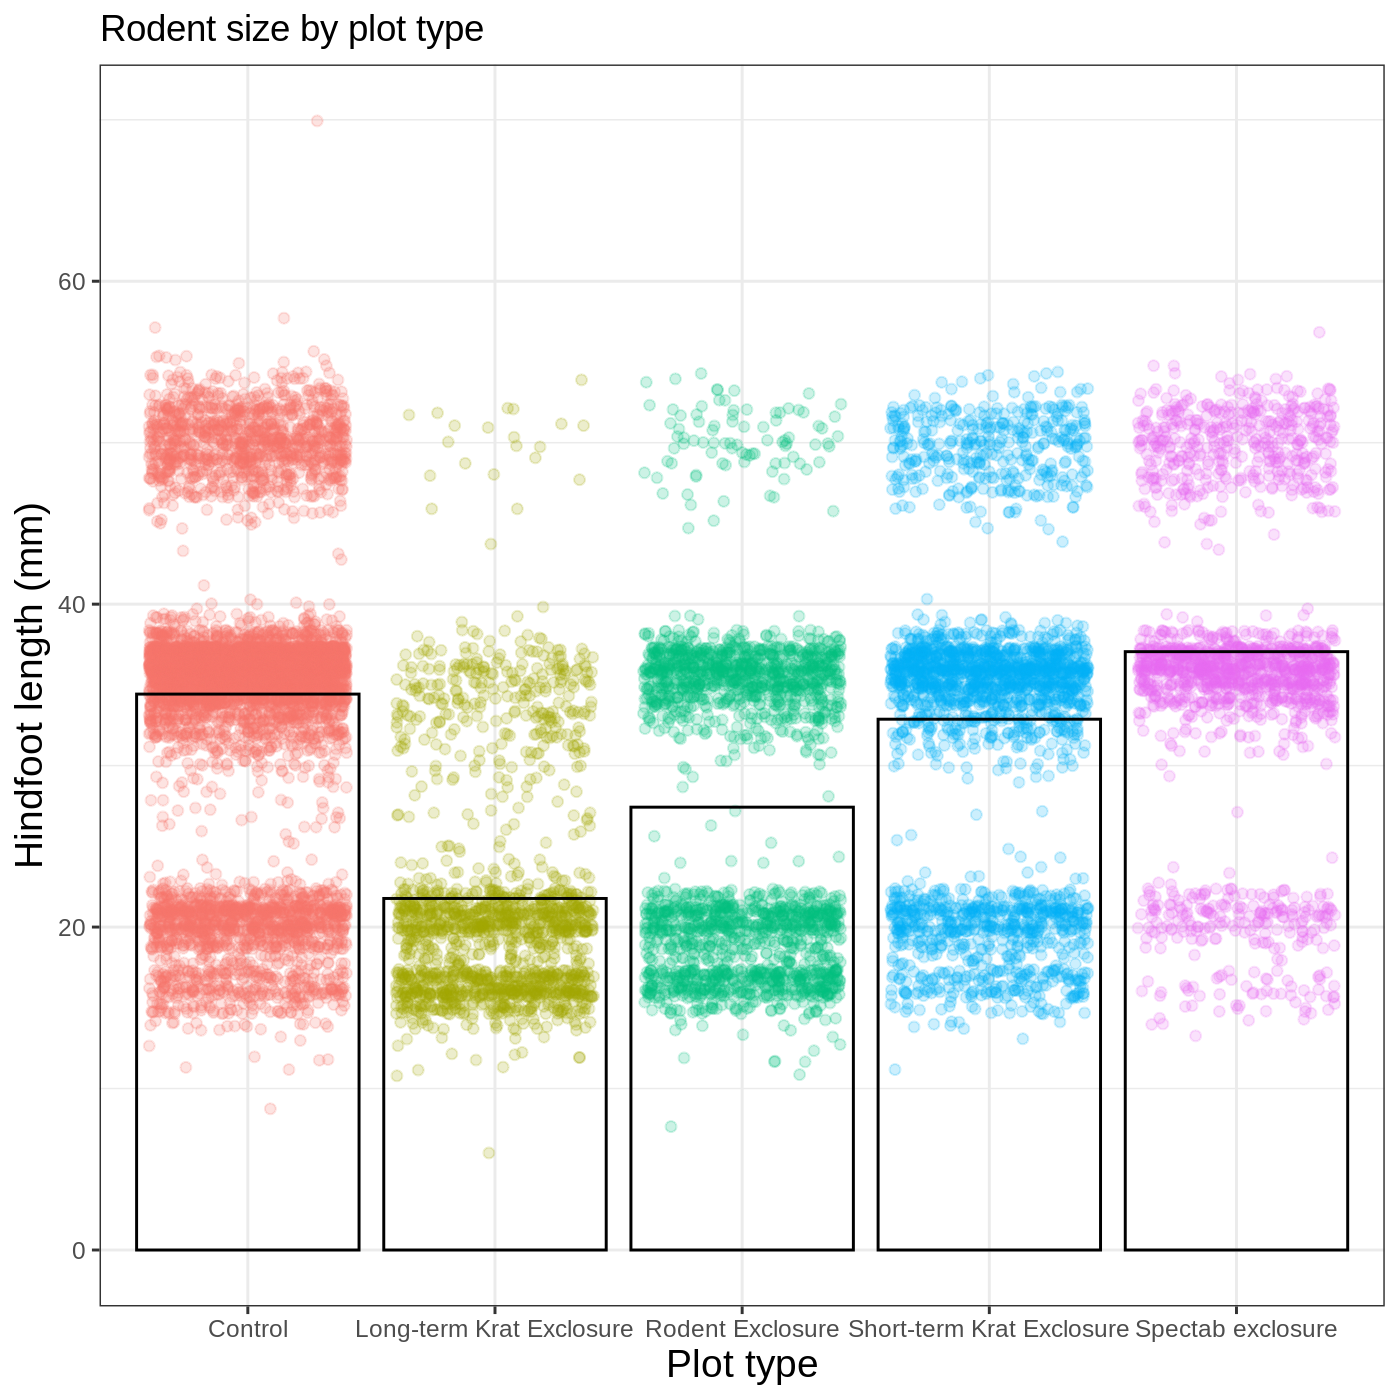
Figure 31
Image 1 of 1: ‘Same plot as before, but now adding a title, a subtitle, and more descriptive labels for the axes.’
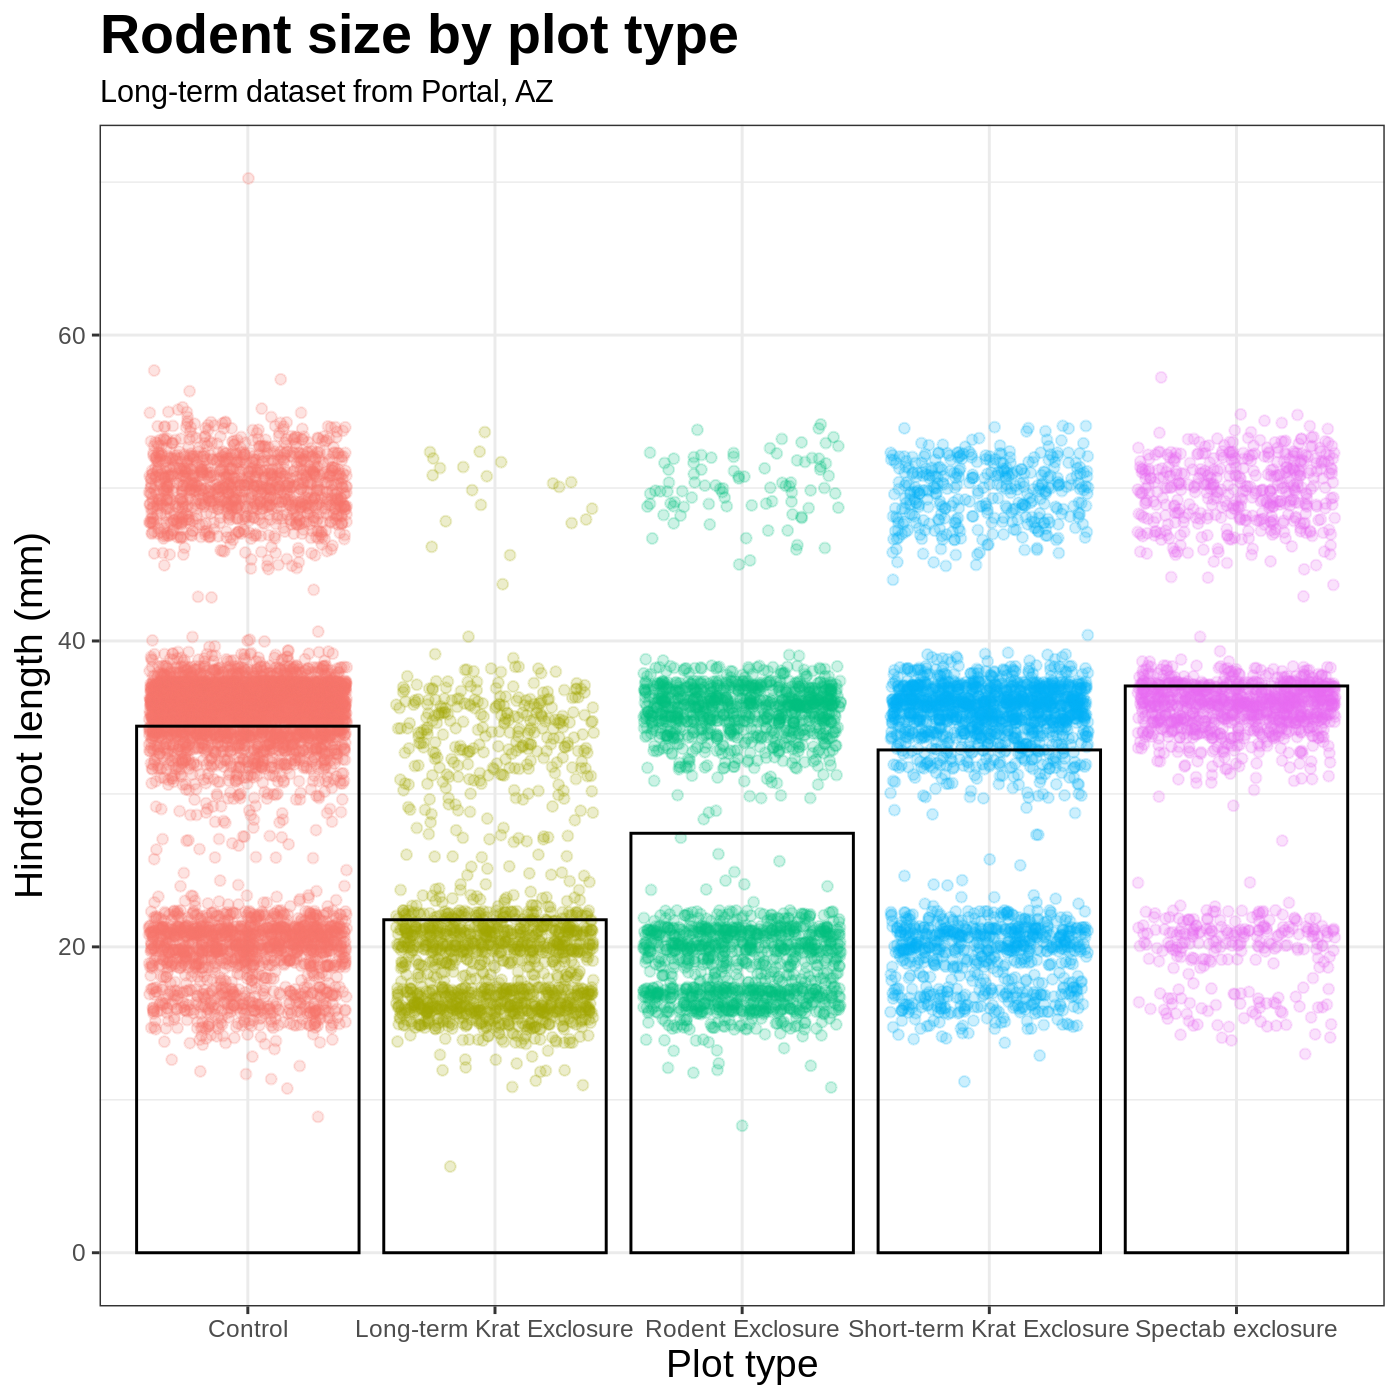
Figure 32
Image 1 of 1: ‘Same plot as before, but now including facets (also called subplots) for each sex.’

Exploring and understanding data
Working with data
Figure 1
Image 1 of 1: ‘Scatter plot showing the weight of the samples (in the y-axis), across time (with the date column in the x-axis)’

Figure 2
Image 1 of 1: ‘Line plot of the number of animals caught (in the y-axis) by date (x-axis) and sex of the animal (different colored lines for each sex)’

Figure 3
Image 1 of 1: ‘Diagram depicting the behavior of `pivot_wider()` on a small tabular dataset.’

Figure 4
Image 1 of 1: ‘Diagram depicting the behavior of `pivot_longer()` on a small tabular dataset.’
