Multimodal Met Museum Semantic Networks
Use case: Extracting semantic concepts from museum objects and visualizing connections
Historically, analyzing visual patterns or latent themes across large-scale physical collections was a manual, slow task reserved for specialists. Traditional computer vision (such as computing color histograms or edge detection) and natural language processing (such as TF-IDF or keyword matching) often miss the “vibe” or deeper contextual and symbolic connections of art.
Using a multimodal Vision-Language Model (VLM) like Gemini, we can perform “semantic feature extraction” (essentially a reverse CLIP approach) to describe and tag visual elements into structured natural language concepts, and map these interconnections into an interactive network similar to this example.
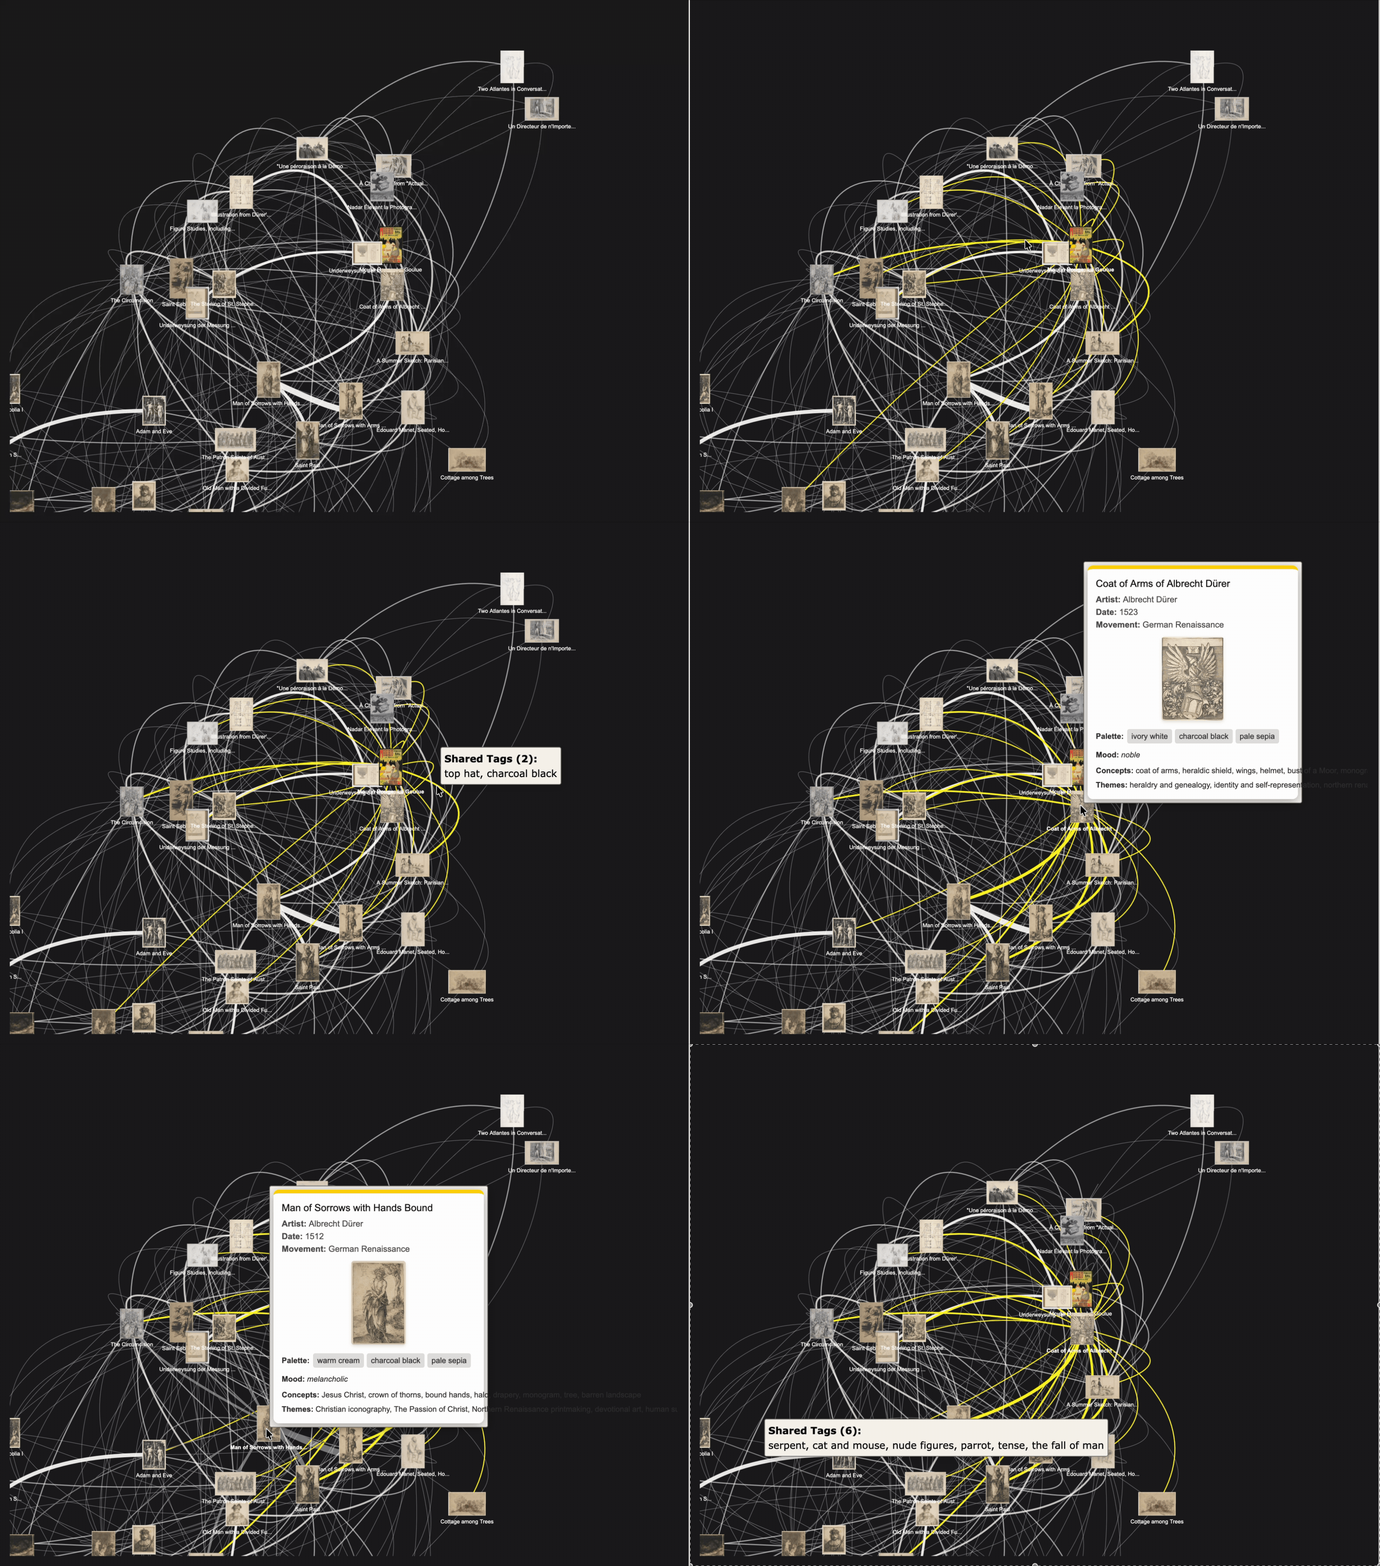
Workflow overview
- Query the Metropolitan Museum of Art Open Access API to fetch public domain paintings.
- Download the images and store metadata locally.
- Use the Gemini API with a
.envfile to programmatically analyze each artwork, returning structured JSON tags (dominant colors, visual subjects, emotional mood, latent research themes). - Build an interactive HTML network graph connecting artworks to their shared semantic concepts.
- Document your work in a Quarto document and share your project on GitHub.
Data and Setup
- API: We will use the The Metropolitan Museum of Art Open Access API, which requires no API keys and allows searching and retrieving public-domain collections.
- Gemini API Key: You must use a
.envfile to securely load yourGEMINI_API_KEY. - Libraries:
- If using Python: favor
requests,python-dotenv,openai, andpyvisfor interactive network visualization. - If using R: favor
httr2,dotenv,openai, andvisNetworkornetworkD3for the interactive network.
- If using Python: favor
- Data Storage: Store images in a local folder (e.g.,
images/) and metadata in CSV files (e.g.,collection_metadata.csvandenriched_collection.csv). - AGENTS.md: You can create an
AGENTS.mdfile to guide your agent’s behavior. You can use_AGENTS.mdas a starting point. Rename the file toAGENTS.mdand add your own instructions for your agent.
Ask
- Session 1: API Fetching & Gemini Feature Extraction
- Brainstorm with your agent in
planmode to handle the Met API query. Fetch details for 15-20 public-domain paintings from a specific department (e.g., “European Paintings” or “Asian Art”). - Some brainstorming prompts for your agent:
- What are the collections with the most public-domain paintings?
- Our goal is to extract semantic concepts from the paintings. What are some ways we can do this?
- We want to retrieve the following metadata for each image: title, artist, year, description. What other metadata might be useful for our analysis?
- What criteria should we use to select the image sample?
- Ensure your agent writes clean, reproducible code to download images to a local folder (e.g.,
images/) and save basic metadata (title, artist, year, medium) to a CSV file. - Switch your agent to
buildmode and instruct it to write a script that securely loads the Gemini API key from.env. - Instruct your agent to generate a script that iterates over the images, sending both the image file and its metadata to Gemini. Instruct the model to return a structured JSON response extracting:
- Dominant palette: 3 distinct visual colors (e.g., “warm gold”, “deep indigo”).
- Visual concepts: Primary subjects/objects visible in the work.
- Mood/Vibe: The overall emotional tone (e.g., “melancholic”, “serene”, “triumphant”).
- Research themes: Latent themes (e.g., “social status”, “nature”, “domesticity”).
- Provide the agent with the service URL
https://litellm.dreamlab.ucsb.edu/and instruct it to use theopenailibrary to send requests. - Combine Gemini’s output with the original metadata into an enriched dataset (e.g.,
enriched_collection.csv).
- Brainstorm with your agent in
- Session 2: Mapping the Semantic Web
- Work with your agent in
planmode to write a visualization script using the enriched dataset. - Define your network logic & edge weights: There are two great ways to model this network:
- Option A: Bipartite Graph (Artworks connected to Tags): Nodes are both Artworks and Semantic Tags (colors, vibes, themes). Edges are unweighted, representing a binary match (e.g., Artwork \(A\) has tag “melancholic”).
- Option B: Projected Graph (Artworks connected to Artworks): Nodes are only Artworks. An edge is drawn directly between Artwork \(A\) and Artwork \(B\). The edge weight is the number of shared semantic tags between them (e.g., if both share “warm gold”, “nature”, and “serene”, the weight is 3). Thicker lines represent stronger visual or thematic links!
- Build an interactive HTML network graph where:
- Nodes represent either the artworks or the extracted concepts, depending on your chosen network logic above.
- Edges (lines) represent connections, optionally adjusting the line thickness (weight) based on the number of shared attributes if using Option B.
- Styling: Color-code artwork nodes by historical century or artistic movement, and attribute nodes by category.
- Before executing the plan, ask your agent for some calculations—for instance, the pairwise connections between artworks based on shared tags, or whether the resulting network is too dense and needs filtering (e.g., only show edges with weight > 1).
- Open the generated HTML and explore the interactive graph. Look for unexpected connections—such as a 17th-century oil painting and a 20th-century piece clustering together based on shared mood or latent research themes.
- Include this interactive visualization in your Quarto document, add your findings and analysis, and publish the final site to GitHub Pages.
- Work with your agent in