Using Agents for Data Visualization and Publication
Generating web pages and data dashboards is one of the tasks LLM agents excel at, particularly when the data is already in hand and the architectural complexity is low. Because many analytical dashboards don’t require complex backend servers, an LLM can easily package your data, interactive visual charts, and text explanations into a single, easily publishable web page.
Prepare the required data and instructions
As usual, the first step is to set up the data and instructions for the agent to follow. In this example, we will use the data already prepared in this repository:
git clone https://github.com/jairomelo/NOAA-water-temp-CA.gitYou can read the README.md file to understand the data and its structure, as well as the code used to download the data from NOAA.
To summarize, the data consists of water temperature measurements from multiple stations along the California coast, collected over several years. The data is stored in CSV files, with each file corresponding to a specific station and containing columns for date, temperature, and other relevant information.
Once we understand the data, we can decide what type of framework we want to use for our dashboard and what type of infrastructure we want to use for hosting it. In this example, we will use Shiny and WebAssembly to create an interactive dashboard that can be hosted on GitHub Pages. The main programming language (R or Python) will depend on your preference, unless you have a specific requirement for one of them. In this example, we will use Python and Shiny to create the dashboard.
Summary of the prerequisites for this example:
- Data: Water temperature measurements from multiple stations along the California coast, stored in CSV files.
- Framework:
Shiny+WebAssemblyfor creating the interactive dashboard. - Hosting: GitHub Pages for hosting the dashboard.
Setting up the project in your workspace
Set your credentials for GitHub in the workspace
Type this command in a separate terminal to set your credentials for GitHub in the workspace:
gh auth loginFollow the prompts to authenticate with your GitHub account. Select https to authenticate the GitHub CLI via the browser (or by pasting a personal access token), or ssh if you plan to use an SSH key for Git operations. After logging in, you can verify that you are authenticated by running:
gh auth statusPrepare the destination repository
In GitHub, create a new, empty repository to host the dashboard. You can name it something like water-temp-dashboard. Do not initialize the repository with a README, .gitignore, or license file, as we will be pushing our local files to this repository later. Copy the URL of the repository, as we will need it later to push our local files to GitHub.
Planning the Dashboard
Let’s instruct the agent on how to build the dashboard. We will provide specific and direct instructions to reduce ambiguity, particularly about data and the features we are requesting.
You are an expert software architect. I need a plan to build a data dashboard.

I want to create a Shiny + WebAssembly dashboard to visualize water temperatures for California stations. The data is here: https://github.com/jairomelo/NOAA-water-temp-CA.

The data shape:
- Range: June 19, 2026 to July 20, 2026.
- Columns: StationID, StationName, Date_Time, Water_Temperature. (Ignore X, N, R columns).

Requirements:
- A dropdown to switch stations.
- A button to toggle Celsius/Fahrenheit.
- Summary cards: Avg Temp, Hottest Day, Coolest Day.
- An interactive map to select stations.

I want to publish this to my own GitHub profile using GitHub Pages via GitHub Actions. Use this empty, public repository: [Include your repository URL].

Please provide the architectural plan, broken down into 3 distinct implementation phases. Do not write the full application code yet.
Choose the options that you want for the dashboard (e.g., which programming language you prefer to use, type of charts, etc.).
Instruct the agent to make any desired changes to the plan. When you are satisfied with the plan, you can move to implementation.
Instruct the agent to build the dashboard
Implementation can be done in phases, as outlined in the plan. You can just ask the agent to implement all phases at once, or you can ask it to implement each phase separately. Depending on the complexity of the dashboard, it may be easier to implement each phase separately and test it before moving on to the next phase.
For instance, for phase 1, you can use a prompt like this:
Let's start with Phase 1.

Please write the code to implement only this first phase. Pay special attention to the data loading step—double-check your logic to ensure the data format and columns are retrieved and parsed correctly based on the repository.

If you need to preview or test the dashboard, run the server in the background using tmux or `&`. Remember to manually stop the server afterward.

Stop after completing Phase 1. Do not write the code for the subsequent phases yet so I can test this basic foundation first.
For phase 2, you can use a prompt like this:
Let's move on to the next phase. Please provide the code to implement Phase 2 (Dashboard Implementation).

Focus on adding the interactive elements: the summary cards, the interactive map, and the main temperature chart. Ensure the reactive logic is fully working—when I change the station dropdown or toggle the Celsius/Fahrenheit button, all the visualizations and cards should update accordingly.

If you need to preview or test the dashboard, run the server in the background using tmux or `&`. Remember to manually stop the server afterward.

Please provide the updated, complete code for the application. Stop after Phase 2. Do not write the deployment/GitHub Actions code yet.Review and polish the dashboard
Before moving to the publication phase, you should review the dashboard and verify that it is working correctly. During development you’ll typically run it locally as a Shiny server; the WebAssembly/static GitHub Pages build comes later in the publication phase. To visually inspect the dashboard, open a new terminal window and run the following commands:
source .venv/bin/activate
shiny run --port 8080
You should see a message similar to this one:
Uvicorn running on http://127.0.0.1:8080 (Press CTRL+C to quit)Look at the logs, and work with the agent to fix any issues that arise. You can also ask the agent to add additional features or polish the dashboard’s appearance.
This step is usually the most time-consuming, as it may require multiple iterations to get the dashboard working correctly and looking good. However, once you are satisfied with the dashboard, you can move on to the publication phase.
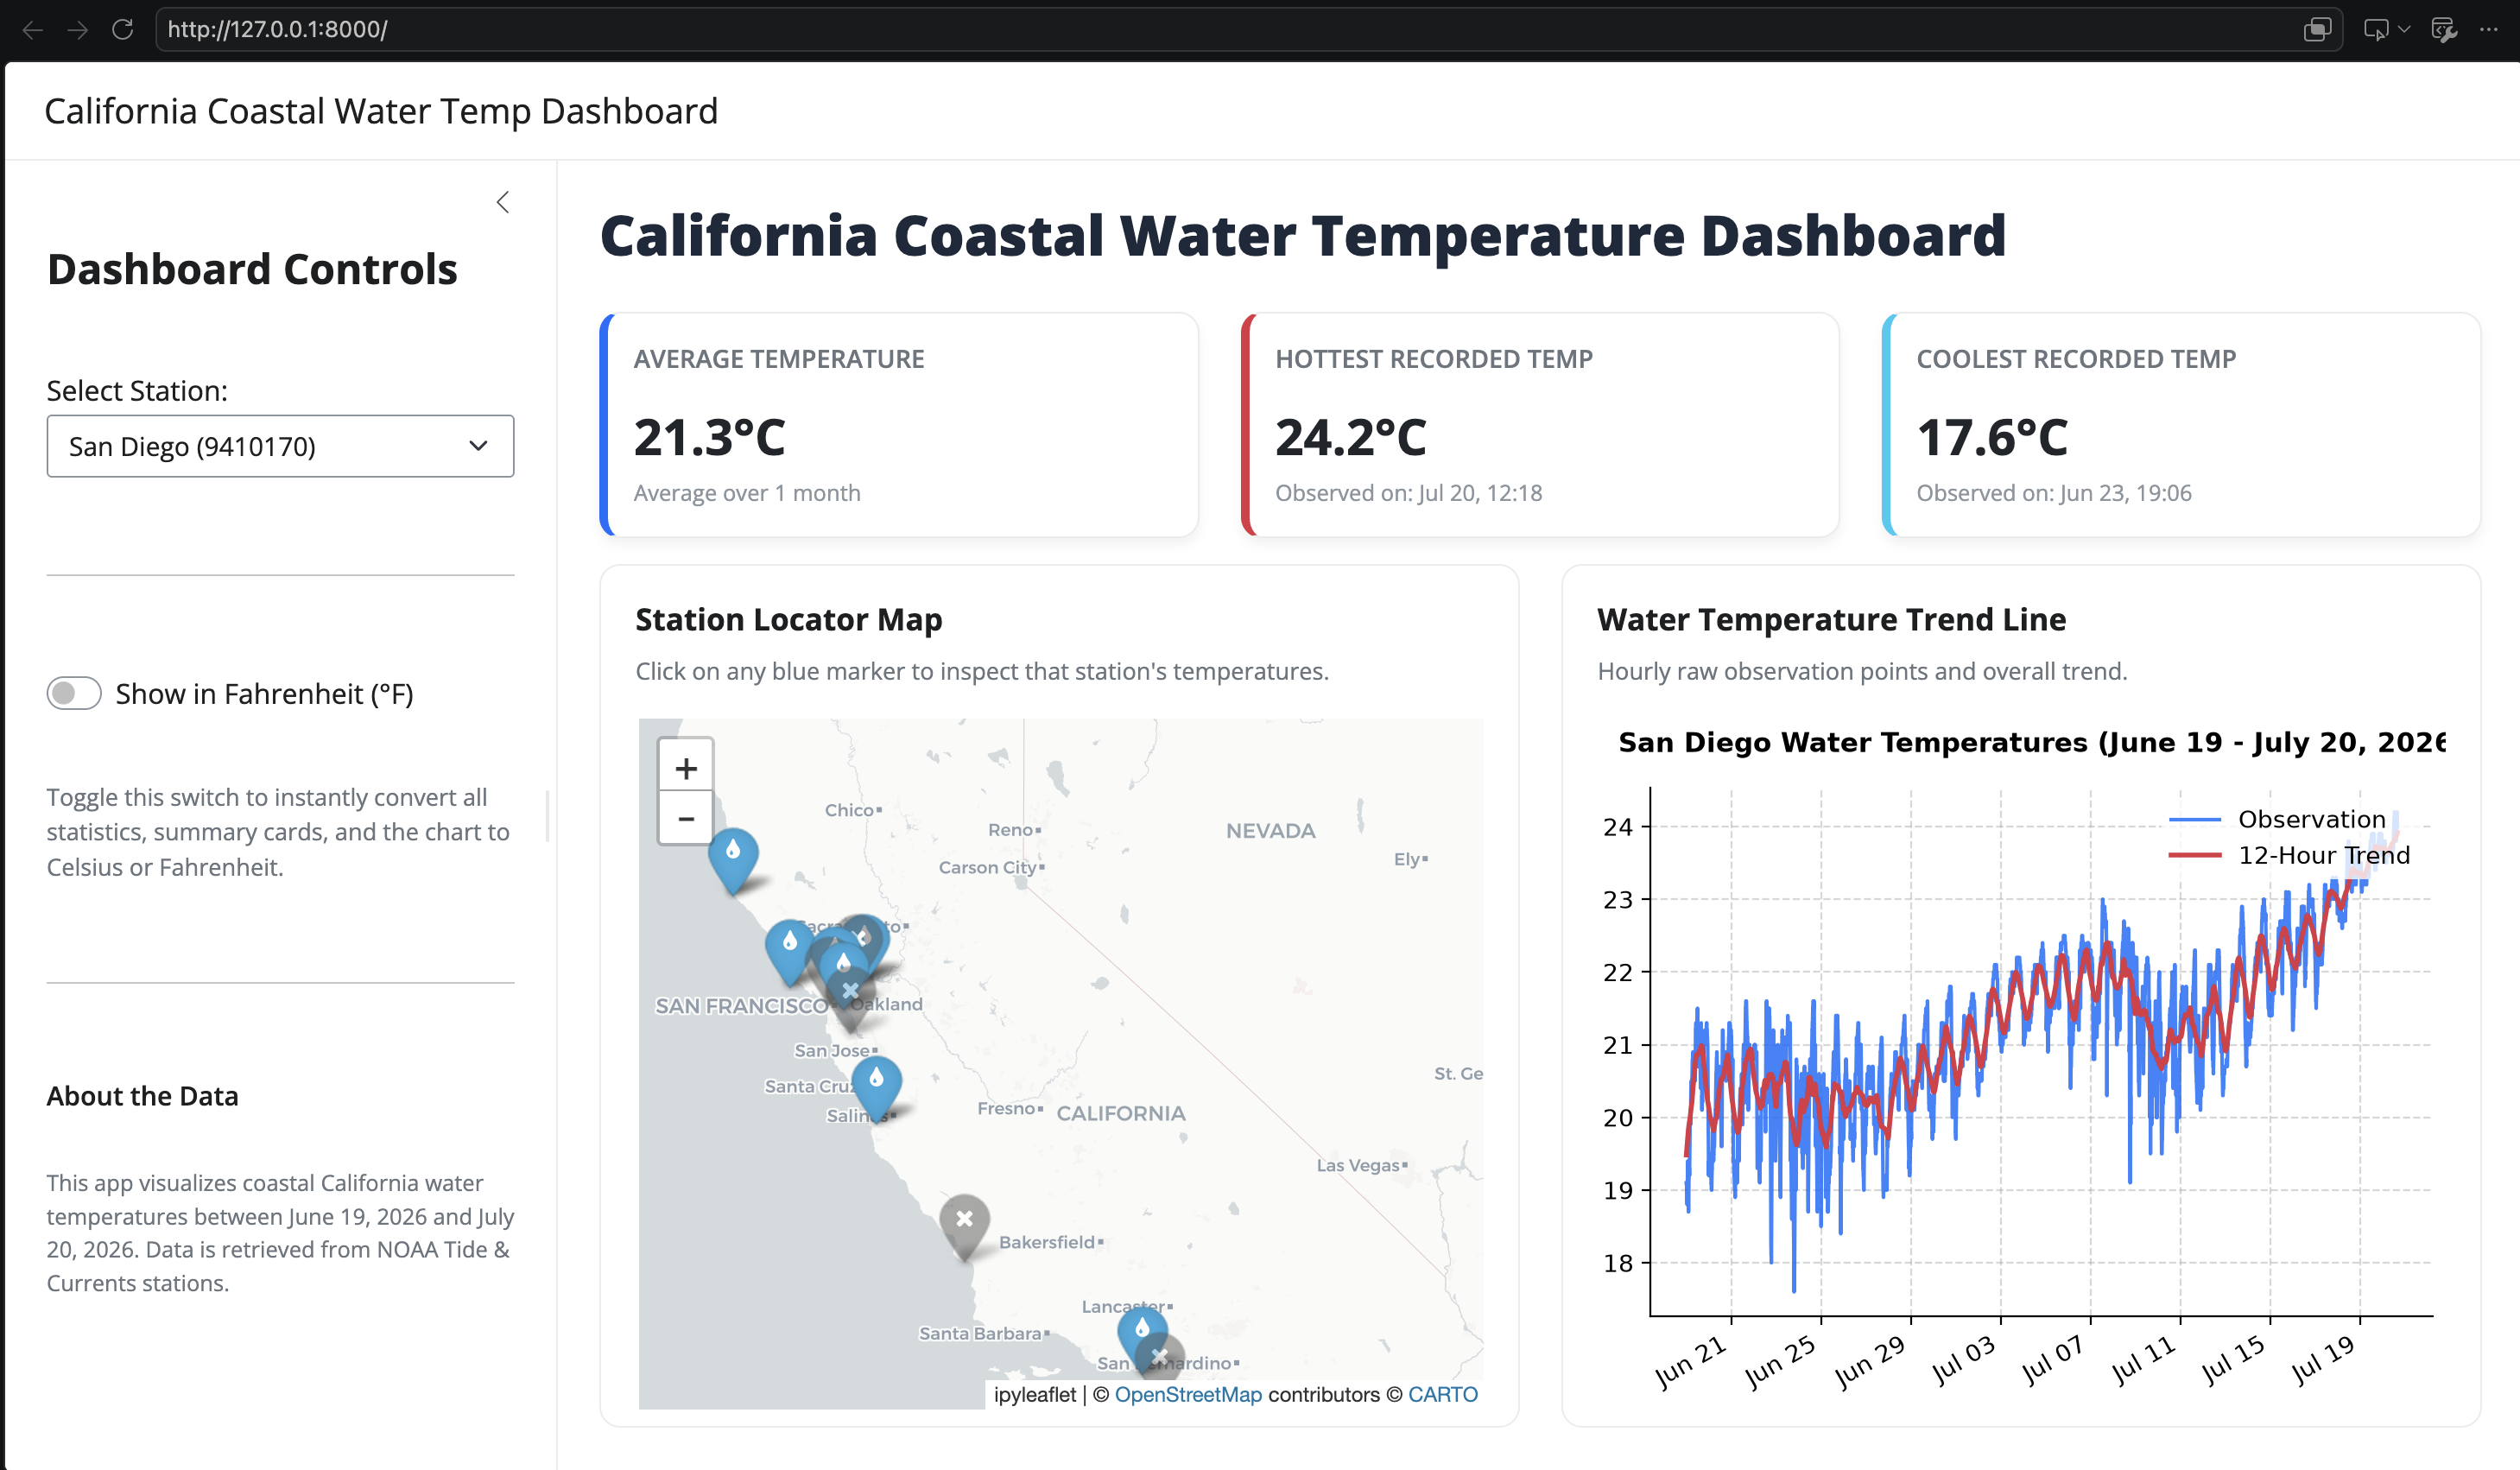
Just for reference, this is what the final dashboard looks like in our case:
Publish!
The next step involves publishing the dashboard to GitHub Pages. You can use GitHub Actions to automate the deployment process. The agent can help you set up the necessary workflow files and configurations to ensure that your dashboard is automatically deployed whenever you push changes to the repository.
A suggested prompt for this step is:
Please implement phase 3 of the plan, including step-by-step instructions to configure GitHub to deploy the Dashboard via GitHub pages.Depending on the previous configuration, the agent may ask you to provide your GitHub username and repository name, and possibly provide some instructions on how to set up GitHub Actions for automatic deployment.
It’s very plausible that you will need to work with your agent to troubleshoot any issues that arise during the deployment process. This may involve checking the GitHub Actions logs, verifying that the workflow files are correctly configured, and ensuring that the dashboard is being deployed to the correct branch and directory.